Generation of the seismic image when source and receiver are not on the same line perpendicular to the layers
This is the most general situation. It applies to the following cases: offset VSP, VSP in a deviated well, seismic walkaway and well-to-well seismic. The processing sequence includes:
- Deconvolution of upgoing waves. The deconvolution operator is unique. It is extracted from traces at the bottom of the well and permits the removal of the effects of the source signal.
- Normal moveout (NMO) Correction and conversion in two-way time of deconvolved upgoing waves. The purpose of this correction is to compensate for the obliquity induced by the source offset, and its object is to take the acquisition geometry into account. Knowledge of the velocity model is necessary to perform this correction.
- Migration: The most commonly method used with a VSP is that proposed by Wyatt and Wyatt (1982). The VSP seismic section obtained after migration is directly comparable to a surface reflection seismic section. The migrated VSP section has a lateral range of investigation of a few tens to a few hundreds of meters.
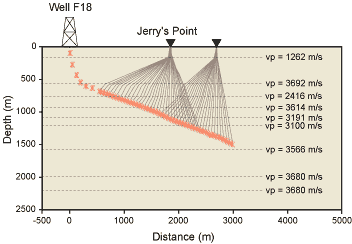
| The example at the right shows a seismic section obtained from data recorded in a highly deviated well on the Wytch Farm Field on behalf of BP-Amoco and Wytch Farm partners. Well data were acquired in the F18 deviated well (which reaches a maximum deviation of 88.5°) with a vibrator source located at a distance of 1,865 m (Jerry's Point -JP-) with respect to the wellhead. Recording was done with a 3-component well geophone of CSI-type (Schlumberger's Combinable Seismic Imager Tool). |

|
The velocity model used to process seismic data was created using the information provided by surface seismic and velocity curves from all the wells in the vicinity of the F18 well. The velocity model was refined by inversion of first arrival time picks, minimizing the difference between measured times and the times calculated by the inversion algorithm. This difference did not exceed 3 ms. the following figure shows the velocity model, the well trajectory, the different positions of the well geophone and the location of source points. For each source point, ray-tracing shows the path followed by the downgoing wave.
The animation illustrates the processing sequence applied to well data obtained with the source located at Jerry Point (JP).
![]() Processing sequences for a with offset VSP
Processing sequences for a with offset VSP