We can make an important error if the fluid is not
water of density 1.0. We then use another series of Charts built for salted
water of density 1.1 for example.
An error much more significant is made when in place of water we have
light hydrocarbons. The density of the fluids is then lower than 1.
The presence of Gas for example with the density tool will give us a reading
of porosity too high (![]() b
decreases) and with de neutron tool a porosity too weak. It results on
the Cross-plot neutron-density a displacement of the point to the top
and towards the left.
b
decreases) and with de neutron tool a porosity too weak. It results on
the Cross-plot neutron-density a displacement of the point to the top
and towards the left.
When the correction for gas is not made, the porosity read on the Chart
is too low. Example the point B which after correction for gas, becomes
point A.
Another factor of error is the presence of clay. Clays
have an high answer in density and neutron . A rock with clay will point
too high in neutron and in density, in the direction (in bottom on the
right) of the shale dot. This shale dot varies according to the type of
clays . We obtain it by transferring on the Chart the apparent porosity,
density, and ![]() t
observed in the vicinity of the clayish layers.
t
observed in the vicinity of the clayish layers.
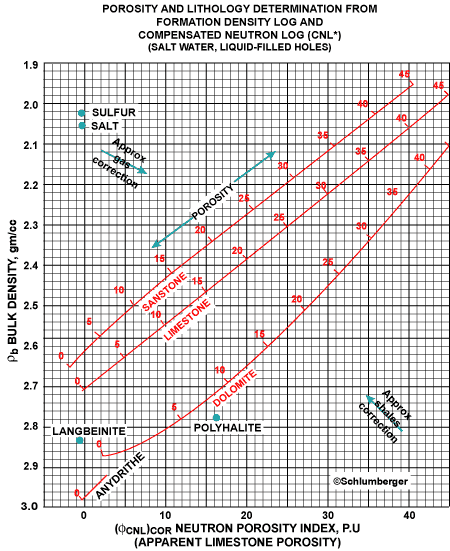
![]() Chart:
determination of the porosity and lithology
Chart:
determination of the porosity and lithology
by density and neutron logs.
| |
Download Chart 9 |
Cross-plot neutron-sonic
In the same way, we can make a cross-plot neutron-sonic while placing
![]() T of sonic
in ordinate. This cross-plot gives good results for lithology, with this
time a correspondence between the 0 neutron and
T of sonic
in ordinate. This cross-plot gives good results for lithology, with this
time a correspondence between the 0 neutron and ![]() T
of 47.5
T
of 47.5 ![]() S/foot
for the sonic.
S/foot
for the sonic.
Cross-plot sonic-density
We can also combine sonic-density. In that case the determination of porosity
is not very good. On the other hand, this cross-plot is interesting for
the determination of the evaporitic formations.